August 31, 2012

Environmental News

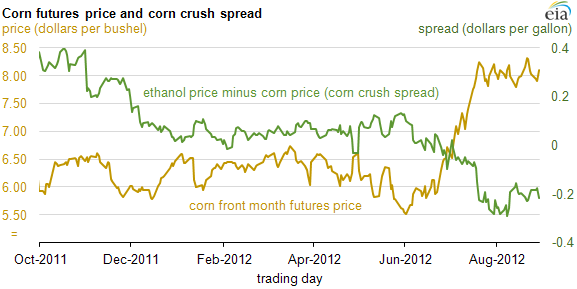
Global food prices jumped 10% in July from the month before, driven up by the severe Midwest drought which has pushed the price of grains to record levels, the World Bank reported Thursday. [Los Angeles Times]
The World Bank issued a global hunger warning last night after severe droughts in the US and eastern Europe sent food prices to a record high. [Guardian]
The League of Conservation voters has started a petition drive calling on PBS's Jim Lehrer, the moderator of the first presidential debate, to force the candidates to answer questions about climate change. [New York Times]
After ignoring the issue of global warming since he began his 2012 run for the White House, Republican nominee Mitt Romney is now invoking it to illustrate a key difference issue between him and President Obama. [National Journal]
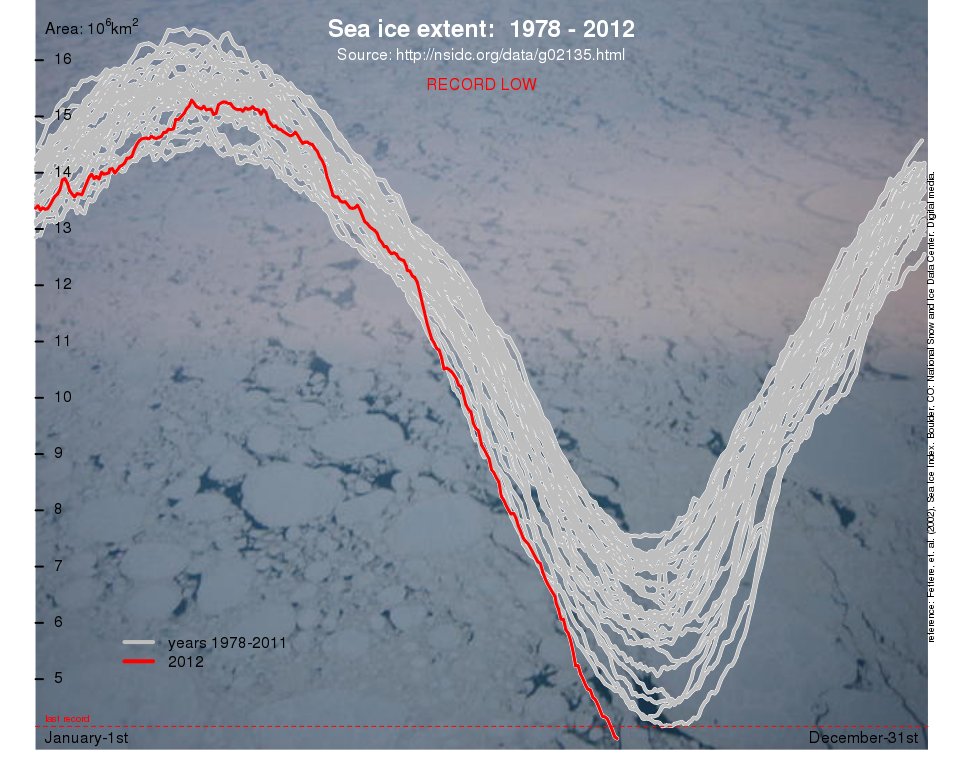
While climate change hasn't played a big role in the 2012 White House campaign, a new report claims that this summer's weather shows an urgent need to address the issue. [The Hill]
Interior Secretary Ken Salazar said Thursday that Royal Dutch Shell would be allowed to start "certain limited preparatory activities" for oil drilling in the environmentally sensitive waters off Alaska's northwest coast. [Washington Post]

US Sets Higher Fuel Efficiency Standards


"Our nation will be more secure, our environment will be cleaner, and consumers will have more money in their pockets as a result of the new rule," said Phyllis Cuttino, director of the Pew Clean Energy Program, an environmental organization based in Washington.

The Obama administration issued the final version of new rules that require automakers to nearly double the average fuel economy of new cars and trucks by 2025.

Current rules for the Corporate Average Fuel Economy, or CAFE, program mandate an average of about 29 miles per gallon, with gradual increases to 35.5 m.p.g. by 2016.

The administration called the new rules "historic," and estimated that Americans would reduce their oil consumption by 12 billion barrels over the course of the program. "These fuel standards represent the single most important step we've ever taken to reduce our dependence on foreign oil," Mr. Obama said in a statement.


Natural Gas and Renewables drive new electricity capacity


Source: U.S. Energy Information Administration, Form EIA-860 "Annual Electric Generator Report" and Form EIA-860M "Monthly Update to the Annual Electric Generator Report." 
Note: 2011 and 2012 data are preliminary. Data include all generators at plants >1MW in capacity, from the electric power, commercial, and industrial sectors. 

Most of the new generators built over the past 15 years are powered by natural gas or wind. In 2012, the addition of natural gas and renewable generators comes at a time when natural gas and renewable generation are contributing increasing amounts to total generation across much of the United States. In particular, efficient combined-cycle natural gas generators are competitive with coal generators over a large swath of the country.

Drought Devastates Corn Crops

The insurance industry faces its biggest ever loss in agriculture as the worst drought to hit the US in more than half a century devastates the country's multibillion-dollar corn and soybean crops, triggering large claims. [CNN]

Higher corn costs, brought on by the most severe U.S. drought in 56 years, has renewed attention on the 5-year-old federal mandate to increase the amount of ethanol blended into gasoline. [Tulsa World]


4 things you should know about the Romney Energy Plan

Romney announced his energy plan last week. Here are the highlights. 

1) Romney plans to remove all federal oversight of public lands including national parks, letting states set standards for oil, gas and coal extraction. 

2) $2.3 billion in additional tax cuts for the big 5 oil companies. By the way, the big 5 oil companies made $137 billion in profits last year. 

3) Romney opposes providing incentives for renewable energy and plans to cut the production tax credit for wind power. 

4) Romney has pledged to eliminate all Obama-era regulations on his first day in office including the mercury and air toxics pollution standards for coal power plants. Coal power plants are the primary source of mercury pollution in our country.  The Center for Disease Control estimates that as many as 1 in 6 women of childbearing age have high enough mercury levels in their blood to harm a developing fetus.


When will we stop burning our food?


Drought is driving corn prices to record levels as we continue to burn 40% of our corn in our engines. 

Researchers at Texas A&M University have estimated that diverting corn to make ethanol forces Americans to pay $40 billion a year in higher food prices. On top of that, it costs taxpayers $1.78 in subsidies for each gallon of gasoline that corn-based ethanol replaces, according to the Congressional Budget Office.

The damage is far-reaching. Beef and pork producers are slaughtering their stocks at a record pace to cut use of corn feed that costs two-thirds more than three months ago. U.S. cattle herds next year are forecast to be the smallest since 1952, a guarantee of more expensive food in years to come.

On top of that, by some calculations, ethanol takes more energy to produce than it yields, negating the environmental benefits. Now the EIA says that ethanol is taking more money to produce than it yields. 
More than 150 House members and 25 U.S. senators, as well as the director general of the United Nations Food and Agricultural Organization, have asked Obama to temporarily suspend the ethanol mandate in order to check the rise in food prices. He should listen to them, and Congress should permanently roll back the ethanol requirements.

Arctic Sea Ice reaches historic low


Arctic sea ice has reached its lowest ever recorded extent, signalling that man-made global warming is having a major impact on the polar region.
With the melt happening at an unprecedented rate of more than 100,000 sq km a day, and at least a week of further melt expected before ice begins to reform ahead of the northern winter, satellites are expected to confirm that 2012 will smash the old record – set in 2007 – within days.

NYC Forms Climate Change Panels

The City Council passed legislation that would make two panels advising the city on the threats of global warming a permanent fixture of government, in an effort to continue Mr. Bloomberg’s environmental focus long after he’s gone. 

The bill,  approved 44-0, will “institutionalize and regularly convene” both a panel of scientists known as the New York City Panel on Climate Change and a task force of government agencies and partners from the energy, telecommunications and other private sectors in charge of recommending how the city should adapt to more frequent storms and heat waves. Under current projections by the scientific panel, sea levels around New York will rise nearly five feet by the end of the century, posing an increased risk of major and more frequent coastal flooding.
The two panels, which receive no pay, were convened by Mayor Bloomberg in 2008 to help fulfill the goals of his environmental agenda for the city, known as PlaNYC. James F. Gennaro, who chairs the council’s committee on environmental protection, said the legislation creates “an institutional government mechanism to assess the latest climate change science, plan for climate change impacts and implement adaptive strategies” and should serve as a model for other local and state governments.
The legislation broadens the responsibilities of the advisory bodies, including requiring the adaptation task force  to create an inventory of potential risks to vulnerable populations like the elderly and low-income residents of industrial areas where flooding also raises the risk of toxic spills. It requires the scientific advisers to meet at least twice a year to review the latest climate change data and to update their projections every three years. The task force is then required to submit its recommendations a year after projections are released.
“We want to make sure that the work of climate change becomes as much a part of city government as repairing pot holes,” said Council Speaker Christine C. Quinn.  “We also want to make sure that PlaNYC remains a living document and a blueprint for the city.”


Romney promises to end federal oversight of oil and gas drilling

Mitt Romney is proposing to end a century of federal control over oil and gas drilling and coal mining on all government lands including national parks. 


Here are five places that could be at risk under a Romney energy plan:
 Grand Canyon National Park:  Even though Interior Secretary Ken Salazar protected one million acres around the Grand Canyon from mining last January, the decision applied only to new claims.  About 3,500 existing uranium claims may still be valid, which could result in up to 11 uranium mines on Bureau of Land Management and Forest Service lands near the canyon.  Under a Romney energy plan, the decision to permit these new mines would be made by the state of Arizona and under its rules and regulations.  Arizona Governor Jan Brewer would likely give the go-ahead to new mining, as she called Salazar’s decision in January “excessive and unnecessary regulation.” 

-  Bryce Canyon National Park:  A strip coal mine is currently being proposed on Bureau of Land Management lands ten miles from the park, but the National Park Service warned that it would “likely result in negative impacts to park resources and visitors” and especially to air quality and scenery.  Under the Romney energy plan, the state of Utah would be responsible for permitting and overseeing the new mine.  Chances are it would be permitted, as Utah already gave the go-ahead to a coal mine right next to the proposed one. 

-  Arches National Park:  The final hours of the George W. Bush presidency saw the issuance of 77 oil and gas leases very close to national parks, including Arches. In January 2009, new Interior Secretary Ken Salazar canceled the leases, saying that they had been rushed.  But that decision is not permanent — if and the oil and gas industry proposed drilling there again, these and other leases on the edges of Arches could move forward.  And the state of Utah would probably accept those industry demands, since its governor and legislature this year called for title to all 30 million acres of public lands to “help foster economic development.”

-  Theodore Roosevelt National Park:  North Dakota is ground zero for the Bakken oil boom, which is pressing up against this national park where President Theodore Roosevelt developed much of his conservation ethic.  Already drilling rigs can be seen from within the park.  And even more could be built if aproposed bridge is permitted that could open up even more of the adjacent Little Missouri Grasslands (managed by the Forest Service) to oil and gas drilling.

-  Grand Teton National Park: This park borders the Bridger-Teton National Forest, home to significant natural gas resources.  Currently the Forest Service is determining whether to allow the drilling of up to 136 natural gas wells on its lands, which could have a number of impacts on the park.  Grand Teton National Park’s superintendent expressed concerns about “degradation of visibility” from the project, and other officials have worried about impacts on the park’s wildlife.  If this decision were turned over to the state under the Romney energy plan, the project could potentially go forward. Wyoming Governor Matt Mead has stated that the company has “valid existing rights.” 

http://nyti.ms/Syv1r5
http://bit.ly/RwEuiC

Keystone XL Construction begins

The Canadian pipeline company TransCanada has quietly begun construction of the southern leg of the controversial Keystone XL pipeline, installing segments near Livingston, Texas, company officials confirmed Thursday.
"Construction started on Aug. 9. So we've now started construction in Texas," TransCanada spokesman Shawn Howard told the Los Angeles Times.
Even without the northern section, company officials have said putting the southern section in place will help alleviate a bottleneck of crude oil at the giant terminal in Cushing, Okla., that has helped depress prices for crude oil generated in North America.
Pipeline opponents, who say the tar sands bitumen is an especially toxic form of oil that poses a hazard to farms, ranches and residential drinking water across the U.S. heartland, are regrouping to fight the revised international permit and to try to slow construction on the southern route, where some landowners still are fighting TransCanada's attempts to gain access to their property.
Protesters unfurled banners Thursday at two equipment staging areas, one in Lamar County, Texas, and one in Cushing, Okla., though TransCanada officials said neither was an active construction site.

August 27, 2012

Healthy Oceans


The New England Aquarium announces the Ocean Health Index with a video narrated by Harrison Ford. 

Green Bronx Machine - Growing our Future


This is a Must See Ted Talk! 

You'll be amazed and inspired to learn all the wonderful things that can happen from starting one garden!!! Wow!!! 

Green Bronx Machine - Growing Our Way Into a new economy

August 20, 2012

Sixty Years of Climate Change


This bell curve graph shows how the distribution of Northern Hemisphere summer temperature anomalies has shifted toward an increase in hot summers. The seasonal mean temperature for the entire base period of 1951-1980 is plotted at the top of the bell curve. Decreasing in frequency to the right are what are defined as "hot" anomalies (between 1 and 2 standard deviations from the norm), "very hot" anomalies (between 2 and 3 standard deviations) and "extremely hot" anomalies (greater than 3 standard deviations). The anomalies fall off to the left in mirror-image categories of "cold, "very cold" and "extremely cold." The range between the .43 and -.43 standard deviation marks represent "normal" temperatures.

As the graph moves forward in time, the bell curve shifts to the right, representing an increase in the frequency of the various hot anomalies. It also gets wider and shorter, representing a wider range of temperature extremes. As the graph moves beyond 1980, the temperatures are still compared to the seasonal mean of the 1951-1980 base period, so that as it reaches the 21st century, there is a far greater frequency of temperatures that once fell 3 standard deviations beyond the mean.

As the graphic indicates, each bell curve shown through the time series represents the distribution of anomalies over an 11-year period.

August 19, 2012

Bike Share Success


Bike shares are one of the fastest-growing modes of transportation in the country. Since the first U.S. bike-share system launched in 2008, the systems have spread like wildfire. Bike sharing allows users to rent bicycles from kiosks placed throughout a city and return them to any other location, creating a hassle-free way to get around. In just four years, 30 U.S. cities have launched bike shares, and many others have plans in the works.  This year alone, 8 new cities have created bike shares and with more set to launch before the end of the year, 2012 may prove to be the biggest year for bike shares yet. Look for your nearest bike share on this map.
Americans are looking for cleaner and more affordable transportation choices. As city centers are choked by automobile traffic, bike shares become an increasingly attractive option for getting around. In Capital Bikeshare's 2011 Member Survey, more than 41 percent of users reported reducing their number of car trips after joining bike share. These users reported driving an average of 523 miles less per year after becoming a bike share member, which translates into avoiding releasing 487.7 pounds of carbon dioxide into the atmosphere per bike share user. In Capital Bikeshare's first year alone, the system's members saved more than 1,632 tons of carbon dioxide just by replacing car trips with bike trips. By reducing our dependency on driving and oil, bike shares can have a significant environmental benefit.
Biking also helps save money by reducing the amount you need to spend on car payments, insurance, and oil. Most bike share systems offer year-long, monthly, and short-term memberships with no additional fees for trips under 30 minutes. With year-long memberships usually priced around $75, the cost of bike share is still very low compared to other means of transportation. In a 2011 Member Survey, Capital Bikeshare users reported saving an average of $819 per year. Most of these savings came from avoiding costs related to driving like gas, parking, and vehicle maintenance. Others reported saving money by replacing taxi trips with bike-share rides.
Another benefit of bike shares is that they not only add another mode of transportation to the existing city fabric but also do so faster and more cheaply than many other transportation projects. Bike shares in cities like Minneapolis and Washington, D.C., took between 12 and 18 months to get up and running after being announced. That seems like the blink of an eye compared to the years and even decades that highway and public transit expansions often take. Though costs vary based on the size and location of the system, Minneapolis-St. Paul was able to implement the first 700-bike phase of their system, Nice Ride Minnesota, for $3.2 million. The cost of creating a single mile of urban highway averages $60 million, making bike sharing a relatively inexpensive way to relieve urban congestion.
Bike shares can also help boost the local economy. Some local bike shop owners in Washington, D.C., were concerned that people might buy fewer bikes if bike sharing were an option. However, Capital Bikeshare proved to be the "gateway drug" for many new bicyclists, who have flocked to bike shops to buy their own set of wheels. Bike shop owners have seen an increase in bike sales in the two years since Capital Bikeshare began operating, and many new customers have said that they were inspired to purchase their own bike after using bike share.
Bike sharing has been around for decades but didn't catch on until technological improvements in the past few years made modern third-generation bike-sharing systems possible. Previous free and coin-operated systems suffered from rampant theft and never caught on, but membership requirements and improvements in bike tracking technology have reduced theft and damage to practically zero. Sophisticated systems that allow bikes to be easily checked-out have also made the systems increasingly popular with users.  European cities began using these advanced bike-sharing technologies for city-wide systems in 2007. After seeing that success and recognizing the increased demand for transportation choices, many U.S. cities quickly followed.
Capital Bikeshare in Washington, D.C., is one of the oldest and best-known bike-sharing systems in the United States. Launched in 2010 with 1,100 bikes at 114 stations throughout Arlington and the District of Columbia, the system now boasts over 1,670 bikes at 175 stations, making it the largest in the country. The program is considered a wild success, with 18,000 members in its first year alone. Large metropolises like Denver and Boston, and even smaller cities like Chattanooga, Tennessee, and Spartanburg, South Carolina, have adopted bike shares.  Many other cities have plans in the works, including New York City's CitiBike system, which will become the nation's largest bike share when it opens later this year, and cities like Los Angeles and Fort Worth, which plan to launch their systems in 2013.
-- Erin Gustafson, Sierra Club Green Transportation 

Arctic Sea Ice Disappearing

The first graph shows sea ice extent – this is the amount of surface area that is covered by ice. As you can see 2007 was the previous worst year on record – but 2012 is beating that record.  

The 2nd graph shows sea ice volume – this is more important than surface area - but tracks the total amount of ice left unmelted.

The 3rd graph shows sea ice extent over the past 110 years.

The 4th graph shows sea ice volume since the 1970s and projects where we are headed.


This site has many graphs showing what is happening with Arctic sea ice.
https://sites.google.com/site/arcticseaicegraphs/


Mutations in Fukushima butterflies

Radioactive materials emitted during the Fukushima disaster caused physical mutations and genetic damage to butterfly populations living near the nuclear plant, a new study says. In a series of tests, Japanese scientists found that butterflies collected from the Fukushima area about two months after the 2011 accident were more likely to have leg, antennae, and wing shape mutations than those found elsewhere.

After breeding these butterflies in a laboratory, researchers found the next generation had numerous abnormalities not seen in the previous generation, including malformed antennae. And adult butterflies collected near Fukushima six months after the initial tests were more than twice as likely to have mutations than those found soon after the accident. 

"It has been believed that insects are very resistant to radiation," said Joji Otaki, a scientist at the University of the Ryukyus, Okinawa, and lead author of the study, told BBC News. "In that sense, our results were unexpected."


Clean energy transition is starting


For the electric power industry, the signs of change are in the air. Power plants are emitting less pollution than in prior years, and renewable power is a bigger part of the energy mix than ever before. That adds up to cleaner air and a more diverse, resilient and lower-carbon electricity system. Ceres assesses the environmental performance and progress of the electric power sector by analyzing the air emissions of the nation's top 100 power producers. This is the eighth edition of the Benchmarking Air Emissions report, and this year, the findings were particularly significant:
  • From 2008 to 2010, sector-wide sulfur dioxide (SO2) and nitrogen oxide (NOx) emissions both fell by over 30 percent.
  • Over the same period, carbon dioxide (CO2) emissions fell four percent and preliminary data show another five percent reduction in 2011.
  • Non-hydroelectric renewable energy accounted for nearly five percent of U.S. electricity generation in 2011. Including large hydroelectric projects, renewables now provide over 10 percent of our power.
Those results speak volumes. Cutting SO2 and NOx emissions by a third in just a couple years is remarkable, and it reflects that a clean energy transition is within reach. The drop in carbon emissions is also encouraging, but it is important to ensure that the trend continues by continuing to emphasize renewable energy and efficiency. What we did with SO2 and NOx, we can do with CO2.
What are the drivers of this remarkable change? Primarily, power producers are shifting away from coal-fired generation to natural gas-fired plants and even cleaner, zero-emissions renewable energy resources such as wind, solar and geothermal energy. They have also installed emissions controls for the coal plants they are running, as additional Clean Air Act rules are set to go into effect over the next few years.
In April 2012, coal- and gas-fired generation were equal for the first time ever. As power producers adjust their generating fleets, gas is being swapped for coal in some cases, but in others, coal plants are being retired outright. According to the 2012 Benchmarking Air Emissions report, 12 percent of the nation's coal-fired generation fleet—about 40 gigawatts of capacity—will be retired. And as the plants that are being phased out are largely older, high-emitting generating units.

James Hansen on Extreme Weather

This is a very interesting article showing how our climate is changing based on data from the Northern Hemisphere. 

It shows quite clearly how the small changes in the average temperature we've already seen have increased extreme events by more than 10x. 


August 15, 2012

Chinese Renewables Commitments


The Chinese government has confirmed it has increased its target for solar energy by 40 per cent, pledging to deploy 21GW of capacity by 2015.

The move represents the second time that China has increased the target, which was first raised from 5GW to 15GW under the country's latest five-year plan.
The NEA said the latest move, which according to local media reports is accompanied by new minimum targets for renewable energy use that will be imposed on energy firms and grid operators, means renewables will account for 9.5 per cent of the country's energy mix by 2015.
The increased solar power target sits alongside existing goals to deliver 100GW of wind power and 290GW of hydropower capacity by the middle of the decade, which look set to further cement China's position as the world's largest renewable energy market.

US CO2 emissions are down!

U.S. carbon dioxide (CO2) emissions resulting from energy use during the first quarter of 2012 were the lowest in two decades for any January-March period. Normally, CO2 emissions during the year are highest in the first quarter because of strong demand for heat produced by fossil fuels. However, CO2 emissions during January-March 2012 were low due to a combination of three factors.
A mild winter that reduced household heating demand and therefore energy use
A decline in coal-fired electricity generation, due largely to historically low natural gas prices
Reduced gasoline demand
CO2 emissions from coal were down 18% to 387 million metric tons in the January-March 2012 period. That was the lowest-first quarter CO2 emissions from coal since 1983 and the lowest for any quarter since April-June 1986. The decline in coal-related emissions is due mainly to utilities using less coal for electricity generation as they burned more low-priced natural gas.
About 90% of the energy-related CO2 emissions from coal came from the electric power sector. Coal has the highest carbon intensity among major fossil fuels, resulting in coal-fired plants having the highest output rate of CO2 per kilowatt-hour.

CA generates 20% electricity from renewables

California power utilities are now achieving more than 20 percent of the state's electricity needs with renewable energy sources, state regulators say. In its latest quarterly report, the California Public Utilities Commission (CPUC) said that the state met 20.6 percent of its electricity demand with renewable sources — including wind, solar, and geothermal — during 2011, up from 17 percent in 2010.

In 2012, the report says, the state is on pace to far surpass that level. According to the CPUC report, 2,871 megawatts of energy capacity from clean sources has been added statewide since ambitious clean energy standards were enacted in 2003, and another 3,000 megawatts are expected to be added during 2012.

Northeast - Hottest Year on Record

The twelve states that make up the Northeastern U.S. are experiencing their hottest year on record, according to data from the Northeast Regional Climate Center at Cornell University.

From January to July, average temperatures in the Northeast were 49.9 degrees Fahrenheit — the warmest such seven month period since record keeping started in 1895.

The Center also released data on the 12-month period from August of 2011 to July of this year, showing that it was the warmest 12-month period on record for the Northeast.

Here are some data points released by the Northeast Regional Climate Center:
  • It was the seventh warmest July since 1895 in the Northeast. The average temperature was 72.8 degrees, which was 2.9 degrees above normal.
  • Each of the 12 states in the region averaged warmer than normal, with departures that ranged from +1.5 degrees in Rhode Island to +4 degrees in Delaware.
  • It was the second warmest July since 1895 in Delaware and the third warmest in Maryland.
  • All 12 states in the region ranked within the top 24 warmest since record keeping began in 1895.
  • With a regional precipitation total of 3.7 inches, the Northeast averaged 87 percent of normal in July. The year-to-date totals averaged 88 percent of normal in the Northeast.
  • Three states, Pennsylvania, (107 percent), Rhode Island (116 percent) and West Virginia (125 percent) had totals that were wetter than normal.
  • It was the driest January through June since 1895 in Delaware and the fifth driest in Maryland.
This isn't just unique to the Northeastern region. According to the National Oceanic and Atmospheric Administration, the rest of the U.S. also saw its warmest period on record from June of 2011 to June of 2012 — with each of the consecutive months ranking among the warmest third of their historical distribution for the first time since record keeping began.

Throughout the U.S. in 2012, more than 27,042 high temperature records were broken or tied as of August 5th.

Meanwhile, 64 percent of the U.S. is facing drought conditions.

Nuclear Power and Climate Change


A reactor at the Millstone nuclear plant in Waterford, Conn., has shut down because of something that its 1960s designers never anticipated: the water in Long Island Sound was too warm to cool it.
Under the reactor’s safety rules, the cooling water can be no higher than 75 degrees. On Sunday afternoon, the water’s temperature soared to 76.7 degrees, prompting the operator, Dominion Power, to order the shutdown of the 880-megawatt reactor.
“Temperatures this summer are the warmest we’ve had since operations began here at Millstone,’’ said a spokesman for Dominion, Ken Holt. The plant’s first reactor, now retired, began operation in 1970.
The chair of the NRC has asked the agency to look into the likely effects of climate change on nuclear power reactors. 
Dr. Macfarlane said the study would cover areas like how plants would fare if storms grew more severe and flooding increased, when cooling water became too hot, and how they might compete for water if rainfall patterns shifted.

August 9, 2012

Extreme Drought


The percentage of the earth's land surface covered by extreme heat in the summer has soared in recent decades, from less than 1 percent in the years before 1980 to as much as 13 percent in recent years, according to a new scientific paper.

The change is so drastic, the paper says, that scientists can claim with near certainty that events like theTexas heat wave last year, the Russian heat wave of 2010 and the European heat wave of 2003 would not have happened without the planetary warming caused by the human release of greenhouse gases. [NY Times]

July 2012 - Hottest Month on Record

July 2012: hottest month on record for contiguous United States

Drought expands to cover nearly 63% of the Lower 48; wildfires consume 2 million acres
The average temperature for the contiguous U.S. during July was 77.6°F, 3.3°F above the 20th century average, marking the hottest July and the hottest month on record for the nation. The previous warmest July for the nation was July 1936 when the average U.S. temperature was 77.4°F. 

Rising Temperature - Rising Food Prices

By Lester R. Brown

Over the last two months, the price of corn has been climbing. On July 19th, it exceeded $8 per bushel for the first time, taking the world into a new food price terrain. 

This is not the way it was supposed to be. This spring, farmers planted a record 96 million acres of corn. An early spring got the crop off to a great start, leading the U.S. Department of Agriculture (USDA) to project the largest corn harvest in history.

On June 12th, the USDA projected the U.S. harvest would hit a record 376 million tons. But the drought conditions that had initially been confined to the country's southwest began to spread and intensify. In its next monthly report on July 11th, the USDA reduced its projection to 329 million tons of corn, down by 12 percent or 47 million tons. This was a huge drop in only one month. Yet in the end the actual decline may be closer to 30 percent, or roughly 100 million tons—double the USDA estimated drop. (See data.)

Because the USDA is overestimating the harvest, it is underestimating the food price rise in the months ahead. Even as corn prices are setting all-time highs, so too are soybean prices, putting still more upward pressure on food prices.

McKibben's Thought for the day

Bill McKibben, founder of 350.org, global thinker and leader, and author of several books; including The End of Nature, and Eaarth: Making a Life on a Tough New Planet, shares this call to action for what could not only be the biggest fight of our time, but of all time. The fossil fuel industry is quickly destroying the planet, and making the fight to protect our future increasingly challenging as industry lobbying, and unabated growth continues. We all need to come together and rally behind leaders like Bill McKibben, 350.org, and countless others, to save this planet. How? With passion, spirit, and creativity, and as Bill says, sometimes putting our bodies on the line. Will you join the fight?

August 8, 2012

Extreme Weather in the Northeast

new report released by Environment America Research & Policy Center analyzed more than 80 million daily precipitation records across the United States from 1948 through 2011. 

The following are highlights from the report:
  • Extreme downpours – rainstorms and snow falls … are now happening 30 percent more often on average across the contiguous United States than in 1948.
  • New England has experienced the greatest change with intense rainstorms now happening 85 percent more often than in 1948.
  • Not only are extreme downpours more frequent, but they are more intense. The total amount of precipitation produced by the largest storm in each year at each station increase by 10 percent over the period of analysis, on average across the contiguous United States.

Electricity and Water

Every year, the United States consumes more than 3 trillion KWh of electricity. This power is generated by coal-fired power plants, nuclear plants, solar panels, hydroelectric damns, wind turbines, geothermal wells, and other sources and it requires water to produce.

As much as 41% of all water used in the United States goes to power plants to produce electricity, making them the single largest water consumer in the nation.

Climate Change is here - and worse than we thought

James Hansen's op-ed in the Washington Post

"When I testified before the Senate in the hot summer of 1988 , I warned of the kind of future that climate change would bring to us and our planet. 
But I have a confession to make: I was too optimistic."
Read the rest of his op-ed here... 
http://wapo.st/OKcLdd

Environmental News

Thousands of fish are dying in the Midwest as the hot, arid summer dries up rivers and causes water temperatures to climb in some spots to nearly 100 degrees. [Wall Street Journal]
About 40,000 shovelnose sturgeon were killed in Iowa last week as water temperatures reached 97 degrees. Nebraska fishery officials said they have seen thousands of dead sturgeon, catfish, carp and other species in the Lower Platte River, including the endangered pallid sturgeon.
Biologists in Illinois said the hot weather has killed tens of thousands of large- and smallmouth bass and channel catfish and is threatening the population of the greater redhorse fish, a state endangered species.
GOP lawmakers say this year's harsh weather that has produced devastating wildfires and the most widespread drought in 50 years has not changed their minds on climate change. [The Hill]

At least 18 wildfires raged in Oklahoma on Sunday as  firefighters battled the consequences of a severe drought that shows no signs of letting up. [Los Angeles Times]

More quickly than any other place in the United States, the Alaskan Arctic is being transformed by global warming. The impacts of climate change are threatening a way of life. [Washington Post]

Ocean acidification caused by climate change is making it harder for creatures from clams to sea urchins to grow their shells, and the trend is likely to be felt most in polar regions, scientists said today. [Sydney Morning Herald]