May 30, 2011

Extreme Weather and Science Budget Cuts

Observations and predictions by climate scientists have for years pointed to global warming causing more intense rainfall; damaging floods and intense droughts; and increasingly unpredictable weather that will expose more people to danger. Recent reports by the National Research Council, an advisory board to the Vatican, and others have pointed to an increasing need for action to reduce the carbon pollution that is destabilizing the climate.
Rep. Ed Markey (D-Mass.), decried the attempts by Republicans to cut important funding to the National Oceanic and Atmospheric Administration and its National Weather Service, which is currently providing important warnings to American citizens in the path of devastating tornadoes. House Republicans are also proposing to end funding for climate research at NOAA that would increase knowledge about the connections between human-driven climate change and extreme weather trends.
"Americans rely on NOAA and its National Weather Service to sound the siren when a storm is approaching, and give timely information to citizens on how to protect themselves from extreme weather events," said Rep. Markey. "It is also vital to continue climate research funding to sound the sirens on the long-term impacts of unchecked global warming and look for ways to cut emissions to protect ourselves from worsening extreme weather trends."
Teeing off the Ryan budget, the Republican committee that controls the purse strings for fiscal year 2012 cut funding to science agencies, including NOAA, by 13 percent from the president's 2012 budget request. If this level of cut is carried through to the NOAA budget, it would decrease by $700 million.
Last year, NOAA also predicted heavy rainfall in the southern United States, providing flood information days, rather than hours, in advance, decreasing risks to life and property.
"When it comes to climate change, there is plenty left to discover, and so much to lose," said Rep. Markey. "Whether the links between these recent events and climate change are direct or indirect, they have all been deadly, and should cause us to look for answers, not sweep the questions under the rug."

May 29, 2011

Record Tornado Activity - Satellite View


The U.S. experienced unprecedented tornado activity throughout the month of April 2011. The NOAA Storm Prediction Center received 875 tornado reports during that month alone; 625 have been confirmed as tornadoes, so far. Many of these storms were concentrated during 7 different major outbreaks, mostly in the Southern U.S. The largest of these outbreaks occurred during April 27-28, leaving over 300 people dead as over 180 storms were reported from Texas to Virginia.


This animation shows the GOES-East infrared imagery from April 1-30, along with the locations of each tornado that formed during the time (symbolized as red dots). Though tornadoes cannot actually be seen by GOES, these satellites are instrumental in being able to detect the conditions associated with their formation. As the resolution of GOES has increased with each successive satellite series, so have the warning times for tornadoes. The future GOES-R satellite will provide even higher resolution and storm prediction capability, especially with the use of the Geostationary Lightning Mapper sensor. 


The actual tornado locations are acquired from the Storm Prediction Center, which uses both NEXRAD radar and ground reports to generate a detailed database of tornadoes in the U.S.

Pentagon Review of Renewable Energy Projects


The 2011 National Defense Authorization Act contains a provision that demands the Pentagon vote up or down on the more than 200 renewable energy-related projects that have run aground over Defense Department concerns about how they might impair national security. That backlog must be evaluated by early July, according to the law.
Before the legislation, the pressure was on developers to prove why a project could work without impeding Defense Department equipment, said Dave Belote, the director of the Pentagon's new energy siting clearinghouse. Now, he explained, the Defense Department must prove why a proposed wind farm or solar array would harm its work and indicate why such problems could not be overcome. The law is also designed to ensure that the department will take steps to register its concerns earlier in the siting process.
Now Pentagon decisions on the fate of renewable energy projects must hinge on whether the proposed projects represent an "unacceptable risk to the national security of the United States."
A member survey from the American Wind Energy Association last year indicated that about 10,500 megawatts of wind power has been either delayed or abandoned due to the objections of federal agencies -- with the bulk of concerns coming from the Pentagon.
The change in process gives industry some comfort, said Tom Vinson, director of regulatory affairs at the American Wind Energy Association. "We like the idea of elevating the response in the Department of Defense to make sure the process has been clearly vetted and that due diligence has been done before DOD issues an answer," he said.
Stopping last-minute objections
With the new process, Belote -- the former commander at Nellis Air Force Base during its own 2009 renewable energy dispute over the nearby proposed 110 MW solar project from SolarReserve -- is charged with thumbing through the renewable energy applications and making recommendations to top-level Pentagon officials about how to proceed with each one.
Before this law, military complaints often came during the final stages of planning -- usually when Federal Aviation Administration personnel first laid its eyes on plans. 


May 27, 2011

Toshiba shifts from nuclear to renewables


Toshiba (the supplier of Unit 3 at Fukushima and the designer of the new AP1000 nuclear reactor) has announced it will push to expand sales in renewable energy rather than nuclear, as workers fighting to contain radioactive spills at the Fukushima Daiichi plant admitted three of the reactors have now suffered meltdowns. 
According to the company President Norio Sasaki, "If everyone around the world is against nuclear power, there is no point in us saying it is a pillar of our strategy."

The manufacturing giant had planned to expand nuclear sales to 1 trillion yen ($12.3 billion) in four years, but now fears that heightened safety procedures sparked by the ongoing crisis will lead to delays. 


Company president Norio Sasaki told reporters yesterday that Toshiba would aim for sales of 350 billion yen ($4.3 billion) in solar, hydroelectric, geothermal and wind power; 800 billion yen ($9.9 billion) in energy-efficient motors, inverters and batteries; and, after announcing its planned purchase of Landis+Gyr, 900 billion yen ($11.1 billion) in smart grid products.
As a result, Toshiba expects to improve its operating profit two times over, rising from 240.3 billion yen ($2.9 billion) in March this year to 500 billion yen ($6.2 billion) by March 2014.
Toshiba recently suffered a setback in Texas when NRG Energy pulled the plug on two nuclear reactors being built by Toshiba in Texas. 
In October 2009, the main contractor on the project, Toshiba informed the investors that the project was likely to cost $4 billion more than estimated. That news was enough for CPS Energy a 50% stakeholder at the time to pull out, to be replaced by the troubled Tokyo Electric Power Company (TEPCO). 

NRC finds design flaws with AP1000 reactor

The Nuclear Regulatory Commission (NRC) released a statement about the new Westinghouse AP1000 nuclear reactor. After a review of the Toshiba-designed reactor, the NRC found: "more problems regarding the AP1000's shield building, as well as the peak accident pressures expected within containment."

The AP1000 is planned to be the backbone of the "nuclear renaissance," and this is only the latest problem with the reactor design. Last year, a former nuclear executive and 39-year industry veteran released an analysis showing that the likelihood of a hole in the steel containment dome is much greater in the AP1000 design than current reactors. 


Westinghouse Electric said it expects no design changes will result from the NRC's request for additional work on the AP1000 advanced nuclear reactor design. 


Twister's Tale


In that swath of the American flatland that has been so brutalized of late, a 93-year-old woman gave me a warning. She had lost her house as a little girl, a homestead property of timber-sheltered memories that shattered in a twister's strike and took to the Oklahoma sky.

She had cautioned me to be wary of springtime — glorious days in a glorious stretch of prairie that can turn deadly on a dime. "Don't get too far from a shelter." Yes, yes, I'd heard plenty about hail the size of grapefruit and how the weather might kick up four things that could kill you — wildfire, blizzard, flash flood, tornado.

But it seemed quaint to these urban ears, a "Wizard of Oz" artifact from Dorothy's pals on the farm. What I learned that afternoon in Tornado Alley is that nothing is more terrifying than a sky of robin's-egg blue turning bruised and churlish, a moment that transforms trees and telephone poles into missiles.

The spring of 2011 is shaping up as one for all the wrong kind of records. Flooding, twisters, Texas wildfires, deaths by fast-moving air that has its own awful category known too well by millions — the Enhanced Fujita Scale, the worst being EF5, winds 200 m.p.h. or more. In a year when almost 500 Americans have died from tornadoes, and 60 or more twisters touch down in a single day, even the cable weather jockeys look humbled as they stand next to flattened neighborhoods.

April and May are the cruelest months, when systems and seasons collide, warm moist air at the surface meeting drier air higher up. Brewing, building, these tornadoes develop out of rotating thunderstorms called supercells.

For an outsider, when the radio suddenly goes into emergency broadcast mode and clouds bleed a ragged black, there is an instant that technical talk turns to terror. You feel exposed in a naked land. You feel a target. You think nothing is permanently anchored. You look for an overpass. You understand, somewhat, what it must have been like in wartime London when the sirens went off in advance of another bombing by the Germans. You feel helpless.

It is human to want to see these storms as part of a larger pattern, to anthropomorphize them with words like "nature's wrath," to ascribe a motive to the mayhem. But also something else: to see a warning of the oldest kind, dating to Greek mythology, a warning about hubris.

Earlier this year, Republicans in a congressional panel declared, by a majority vote, that climate change caused by humans does not exist. The majority of the House then voted to get rid of federal funding for the world's finest scientists in the field to study the changing earth, through the Intergovernmental Panel on Climate Change. Blink, blink, just like that — our representatives wished away the future.

The twisters, floods and fires of this year have another say, and remind us that some political gestures are no more relevant than a lone pair of lips flapping in the wind. Of course, among atmospheric scientists there is ambiguity, at best, about whether global warming has anything to do with the worst tornado season in modern times.

But the consensus of fair-minded research — ignored by those who assume to know better in the Republican Congress — is that an earth warmed by an excess of man-caused carbon emissions will cause more weather extremes. Warm air holds more water vapor than cold air — that's an axiom that a congressman with a set of talking points paid for by Exxon cannot wish away. Torrential flooding in all parts of the world could easily be part of a new phase brought on by just a few upticks in ocean temperatures. The forecast is simple: You ain't seen nothing yet.

To recognize this threat, even with its implicit calls for sacrifice in a country that cannot tolerate $4 a gallon gas, is not to be alarmist. The unknown — that is, any possible link between a surfeit of lethal tornadoes and a warmer planet — makes a case for proceeding with caution. We treat our bodies that way, most of us; when a warning comes out of possible cancer links to a food or substance, sensible people change course.

But there is a loud and intellectually corrupt segment of public life dedicated to fact-denial. They will not allow even a slim chance that humans are making a mess of this place. They will not do what a homeowner facing unlikely odds of a fire has to do just to hold a mortgage — take out insurance.

Listen to people who have lived long lives in the American midsection, a place of peril, and a place that is deeply loved. They tell us to be prepared, to be humble in the face of nature, to think about the worst thing that could come from the sky. If this is radical advice, then common sense has surely met an early death.

Timothy Egan worked for The Times for 18 years – as Pacific Northwest correspondent and a national enterprise reporter. His column on American politics and life as seen from the West Coast appears here on Fridays. In 2001, he was part of the Pulitzer Prize-winning team that wrote the series "How Race Is Lived in America." He is the author of several books, including "The Worst Hard Time," a history of the Dust Bowl, for which he won the National Book Award, and most recently, "The Big Burn: Teddy Roosevelt and the Fire That Saved America."

Worldwide Reaction to Fukushima

The Swiss cabinet called for the decommissioning of the country's five nuclear power reactors and new energy sources to replace them. The recommendation would result in the Swiss reactors going offline between 2019 and 2034.

Meanwhile in earthquake prone Italy, the Italian government has won a confidence vote on measures that include shelving plans to build new nuclear power plants. Earthquake-prone Italy is the only member of the G8 nations that does not produce nuclear power. Italians voted against it in a 1987 referendum after the Chernobyl nuclear catastrophe.

In Germany, Merkel said the year 2022 was "the right space of time" to set as a goal for Germany's total withdrawal from nuclear power. 


At the same time Sarkozy is maintaining France's dependence on atomic energy, and UK Prime Minister David Cameron warned against a "rush to judgement" on nuclear safety. The UK and France have also managed to have terror attacks excluded from a series of new nuclear safety tests in response to the crisis at Fukushima. 

Japan will aim to generate at least 20 per cent of its electricity from renewable source by the 2020s. Prior to the disaster, Japan was the world's third-largest user of nuclear power and was seeking to meet half of its electricity needs by 2030 with new reactors, up from around 30 per cent currently.


Prime Minister Naoto Kan said Japan would work to cut solar power generation costs to one-third of the current level by 2020 and one-sixth a decade later, while aiming to fit solar panels on 10 million roofs by 2030.
"We will do everything we can to make renewable energy our base form of power, overcoming hurdles of technology and cost," Kan said.


May 25, 2011

New mileage stickers compare CO2 emissions

The new labels will compare a vehicle’s emissions of carbon dioxide with those of all other vehicles, as well as provide miles-per-gallon data.


1. Vehicle Technology & Fuel

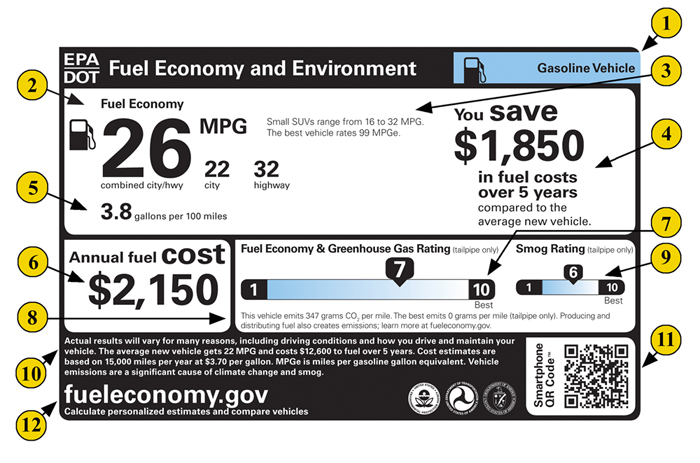
The upper right corner of the label displays text and a related icon to identify it as a vehicle that is powered by gasoline. You will see different text and icons in the labels for other vehicles:
  • Diesel Vehicle
  • Compressed Natural Gas Vehicle
  • Hydrogen Fuel Cell Vehicle
  • Flexible-Fuel Vehicle: Gasoline-Ethanol (E85)
  • Plug-In Hybrid Vehicle: Electricity-Gasoline
  • Electric Vehicle
Note that hybrid gasoline-electric vehicles that do not have plug-in capability are identified as gasoline vehicles since they only use gasoline.

2. Fuel Economy

For gasoline vehicles, the label shows City, Highway, and Combined MPG (miles per gallon) values.  The Combined MPG value is the most prominent for the purpose of quick and easy comparison across vehicles.  Some form of the miles per gallon metric has been on vehicle labels since 1977.  Combined fuel economy is a weighted average of City and Highway MPG values that is calculated by weighting the City value by 55% and the Highway value by 45%.

3. Comparing Fuel Economy to Other Vehicles

This text indicates the category of the vehicle (e.g., Small SUV, Station Wagon, Pickup Truck, etc.) and the best and worst fuel economy within that category for the given model year.  There are nine car categories, six truck categories, and a “special purpose vehicle” category.  These categories are used only for labeling and consumer information purposes and do not serve any other regulatory purpose.  For each model year, EPA publishes lists identifying the best and worst fuel economy performers in each category available at http://www.epa.gov/fueleconomy/data.htm.
This text also tells you the best combined fuel economy among all new vehicles.
Note: for those vehicles that do not use liquid fuels--such as electric vehicles, plug-in hybrid electric vehicles operating on electricity, and compressed natural gas vehicles-- the labels display miles per gallon of gasoline-equivalent (MPGe).  Think of this as being similar to MPG, but instead of presenting miles per gallon of the vehicle’s fuel type, it represents the number of miles the vehicle can go using a quantity of fuel with the same energy content as a gallon of gasoline.  This allows a reasonable comparison between vehicles using different fuels. For example, you can use MPGe to compare a compressed natural gas (CNG) vehicle with a gasoline vehicle; even though CNG is not dispensed or burned in actual gallons.

4. You Save/Spend More over 5 Years Compared to Average Vehicle

The label shows the estimated fuel cost over a five-year period for the vehicle compared to the average new vehicle. If the vehicle would save the consumer money compared to the average vehicle, the label would state, “You save $x,xxx in fuel costs over 5 years compared to the average new vehicle.” If the vehicle would be more expensive to operate than the average vehicle, the label would state, “You spend $x,xxx more in fuel costs over 5 years compared to the average new vehicle.”   These estimates are based on driving 15,000 miles per year, for five years, and the projected fuel price for the year ($3.70 per gallon of gasoline in this example).   For more information on the source of projected fuel prices see “10.  Details in Fine Print”.

5. Fuel Consumption Rate

While a miles per gallon (MPG) estimate is a required feature that has appeared on the fuel economy label for several decades, this metric can be potentially misleading when consumers compare fuel economy improvements, particularly when they use it in place of fuel costs.  The following chart shows the non-linear relationship between gallons used over a given distance and miles per gallon.  The fuel savings, in gallons, for a vehicle that gets 10 MPG versus a vehicle that gets 15 MPG is about 33 gallons (assuming 1000 miles). On the other hand, the fuel savings in gallons, for the same 5 MPG fuel economy jump, for a 30 MPG versus a 35 MPG vehicle is only about 5 gallons.
Fuel Consumption Rate
This “MPG illusion” demonstrates why it may be more meaningful to express fuel efficiency in terms of consumption (e.g., gallons per mile or per 100 miles) rather than in terms of economy (miles per gallon).  A fuel consumption metric allows for more accurate energy usage comparisons among vehicles.
The revised label includes both fuel economy and consumption information for all vehicle types.

6. Estimated Annual Fuel Cost

The annual fuel cost is based on two assumptions: an annual mileage of 15,000 miles and a projected gasoline price.  For more information on the source of projected fuel prices see "Details in Fine Print”.

7. Fuel Economy & Greenhouse Gas Rating

The new label assigns each vehicle a rating from 1 (worst) to 10 (best) for fuel economy and greenhouse gas (GHG) emissions (i.e., how much carbon dioxide the vehicle’s tailpipe emits each mile), as shown below. Consumers may note that higher fuel economy is associated with a better GHG emissions profile.
There are two ratings that apply to each vehicle—one for fuel economy and one for greenhouse gas emissions—but gasoline vehicles will display only one rating.  This is because carbon dioxide emissions are directly related to the amount of fuel consumed.  This relationship varies from fuel to fuel, but both rating systems are based on gasoline vehicles, meaning that gasoline vehicles get the same rating for fuel economy and for greenhouse gas emissions.
RatingMPGCO2 (g/mile)
1038+0-236
931-37237-290
827-30291-334
723-26335-394
622395-412
519-21413-479
417-18480-538
315-16539-612
213-14613-710
10-12711+

8. CO2 Emissions Information

This text provides three key pieces of information:
Combined city/highway CO2 tailpipe emissions
The labeled vehicle’s CO2 tailpipe emissions are based on tested tailpipe CO2 emission rates.  The rate of CO2 emissions is displayed in grams per mile.
Vehicle with lowest CO2 emissions
The label identifies the lowest tailpipe CO2 emissions of available vehicles.  If there are electric or fuel cell vehicles on the market, which by definition have zero tailpipe emissions, this value will be zero grams per mile.
Learn more about emissions from the production of fuels at www.fueleconomy.gov
Driving your vehicle can yield both greenhouse gas (GHG) emissions from your vehicle's tailpipe and GHG emissions related to the production of the fuel used to power your vehicle.  For example, activities associated with fuel production such as feedstock extraction, feedstock transport to a processing plant, and conversion of feedstock to motor fuel, as well as distribution of the motor fuel, can all produce GHG emissions.
The Fuel Economy and Environment Label provides a Greenhouse Gas Rating, from 1 (worst) to 10 (best), based on your vehicle's tailpipe carbon dioxide emissions only, and this rating does not reflect any GHG emissions associated with fuel production.
You can estimate the total GHG emissions that would be associated with driving an electric vehicle or plug-in hybrid electric vehicle, including GHG emissions from the production of electricity used to power the vehicle, with our greenhouse gas calculator.

9. Smog Rating

This is a rating for vehicle tailpipe emissions of those pollutants that cause smog and other local air pollution. This information, listed as “Smog” on the labels, will be displayed using a slider bar with a scale of 1 (worst) to 10 (best).  The scale is based on the U.S.  vehicle emissions standards, which incorporate specific thresholds for nitrogen oxide, non-methane organic gas, carbon monoxide, particulate matter, and formaldehyde.  For those vehicles that run on electricity, the tailpipe emissions are zero.

10. Details in Fine Print

This part of the label has a reminder that your fuel economy and emissions may be different due to a number of factors, such as how you drive and maintain your vehicle, how much you use air conditioning and other accessories, the weather, road conditions, how much the vehicle is loaded, and other factors.  EPA periodically evaluates ways to improve our fuel economy estimates so they better reflect real-world driving.  For more information on how your fuel economy can vary, or tips to improve your fuel economy, please see Gas Mileage Tips.  
This part of the label also details the assumptions that are used to determine the estimated annual fuel cost and the value used to compare 5-year costs to the average vehicle.  EPA assumes annual mileage of 15,000 miles.  The price of gasoline listed on new vehicle labels is based on projections from the U.S. Energy Information Administration for the applicable model year. It will typically be updated annually in coordination with the Department of Energy.  Since EPA won't publish the fuel prices for 2013 model year labeling until 2012, the sample labels include an example price that is intended for illustrative purposes only.

11. QR Code®*

When you are looking for a new vehicle at a dealership, you will be able to scan the QR Code® on the new label using your smartphone, provided you have downloaded a scanner app.  The QR Code® will link you to helpful tools and additional information about the vehicle. The same tools and information are available on www.fueleconomy.gov.

12. fueleconomy.gov

The label directs you to the fueleconomy.gov web site, where you can compare vehicles and enter personalized information (e.g., local gas prices and individual driving habits) to get the best possible cost and energy-use estimates.